| OPTIONS WITH HANS | Thursday, September 3, 2026 |
One Dovish Governor Undid The Whole Week. |
Two days ago the ten-year was at 4.80% and September rate-hike odds were 70%. Today Fed Governor Waller suggested he'd be willing to stay patient on additional hikes if inflation data keeps cooperating, and the whole thing unwound. Ten-year down to 4.77%, two-year toward 4.33%, hike odds cut in half to 50%. SPX closed 7747.71, up 1.06%, its best day in a month. Every major index green, financials leading at +1.54%.
Underneath, this was the day the two halves of the market finally moved together. Snowflake beat and raised and went up 20%, dragging software with it. Semis finished higher even with Broadcom trading lower after its print — and AVGO closed well off its morning lows, which matters more than the red number. Crypto and the agentic complex woke up hard on the back of Bitcoin's move. Gold ripped 2.5% as the dollar fell below 99.
The one thing that didn't participate: energy, down 0.69%, and materials. Which is the reverse of the last two weeks. Nonfarm payrolls tomorrow morning, expected 56,000 after last month's surprise -23,000. |
The Relief Rally |
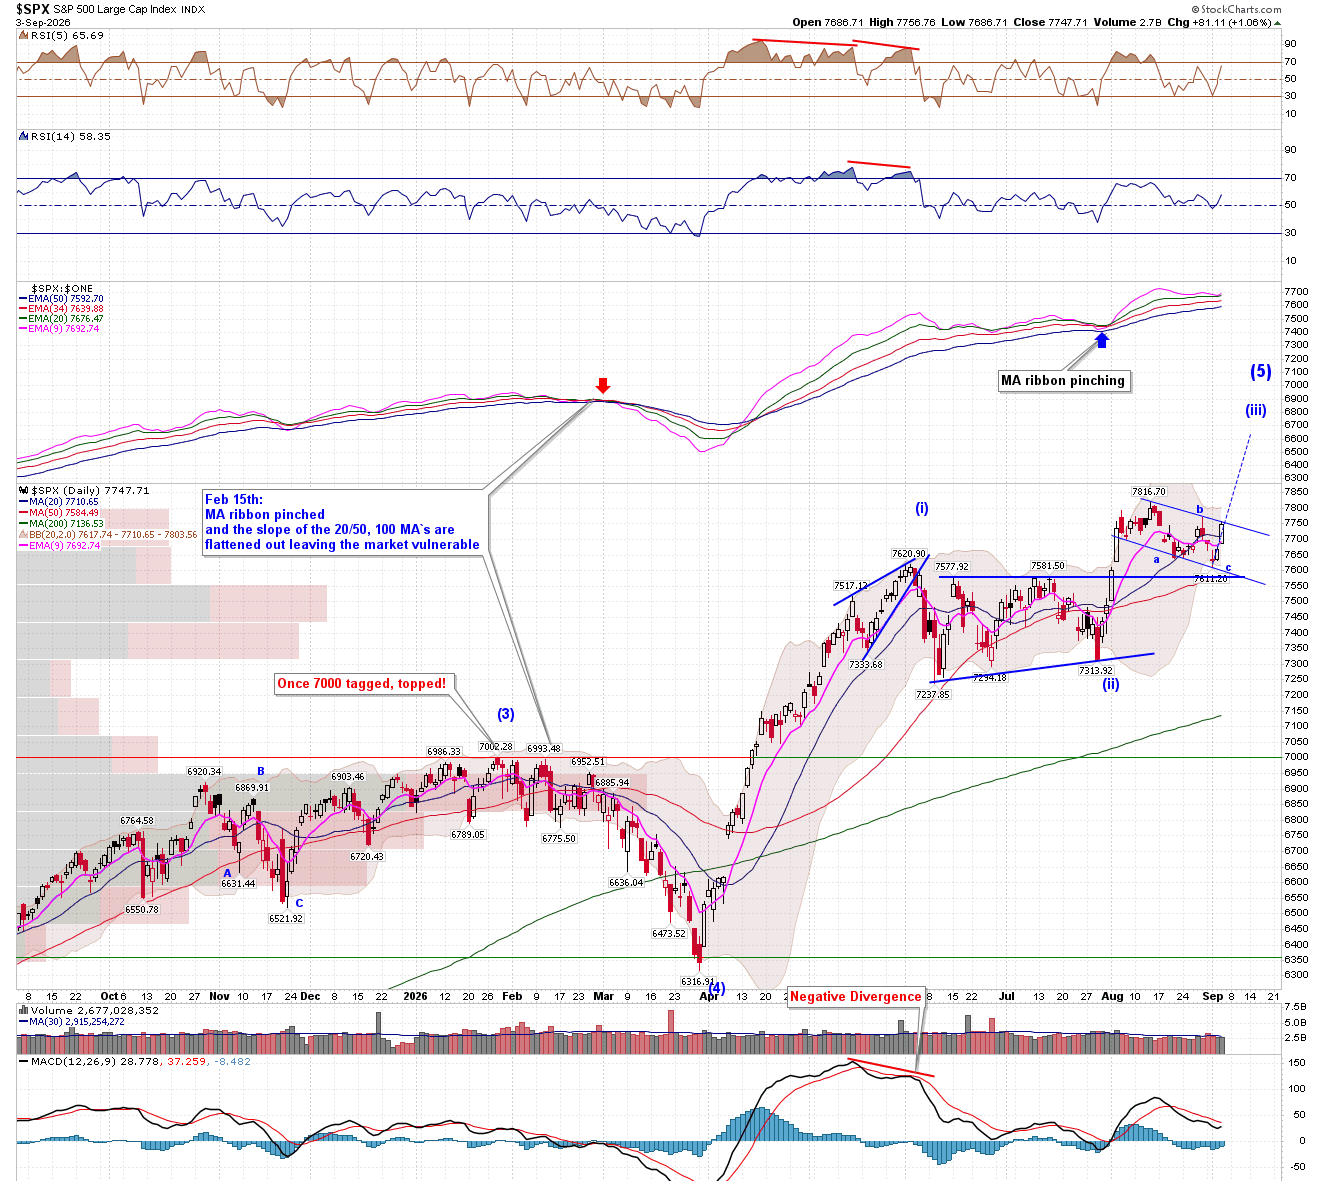 |
| SPX closed 7747.71, up 1.06%, its best single day in about a month and back near the top of the range it's held since early August. All it took was one Fed governor sounding patient. |
| Hans's take: Two sessions ago this tape was coming apart on 4.80% yields. Today it's near the highs. That's the market we're in — you cannot pick tops and bottoms in this thing, realized volatility is too big and the moves aren't meaningful enough to trade around. |
|
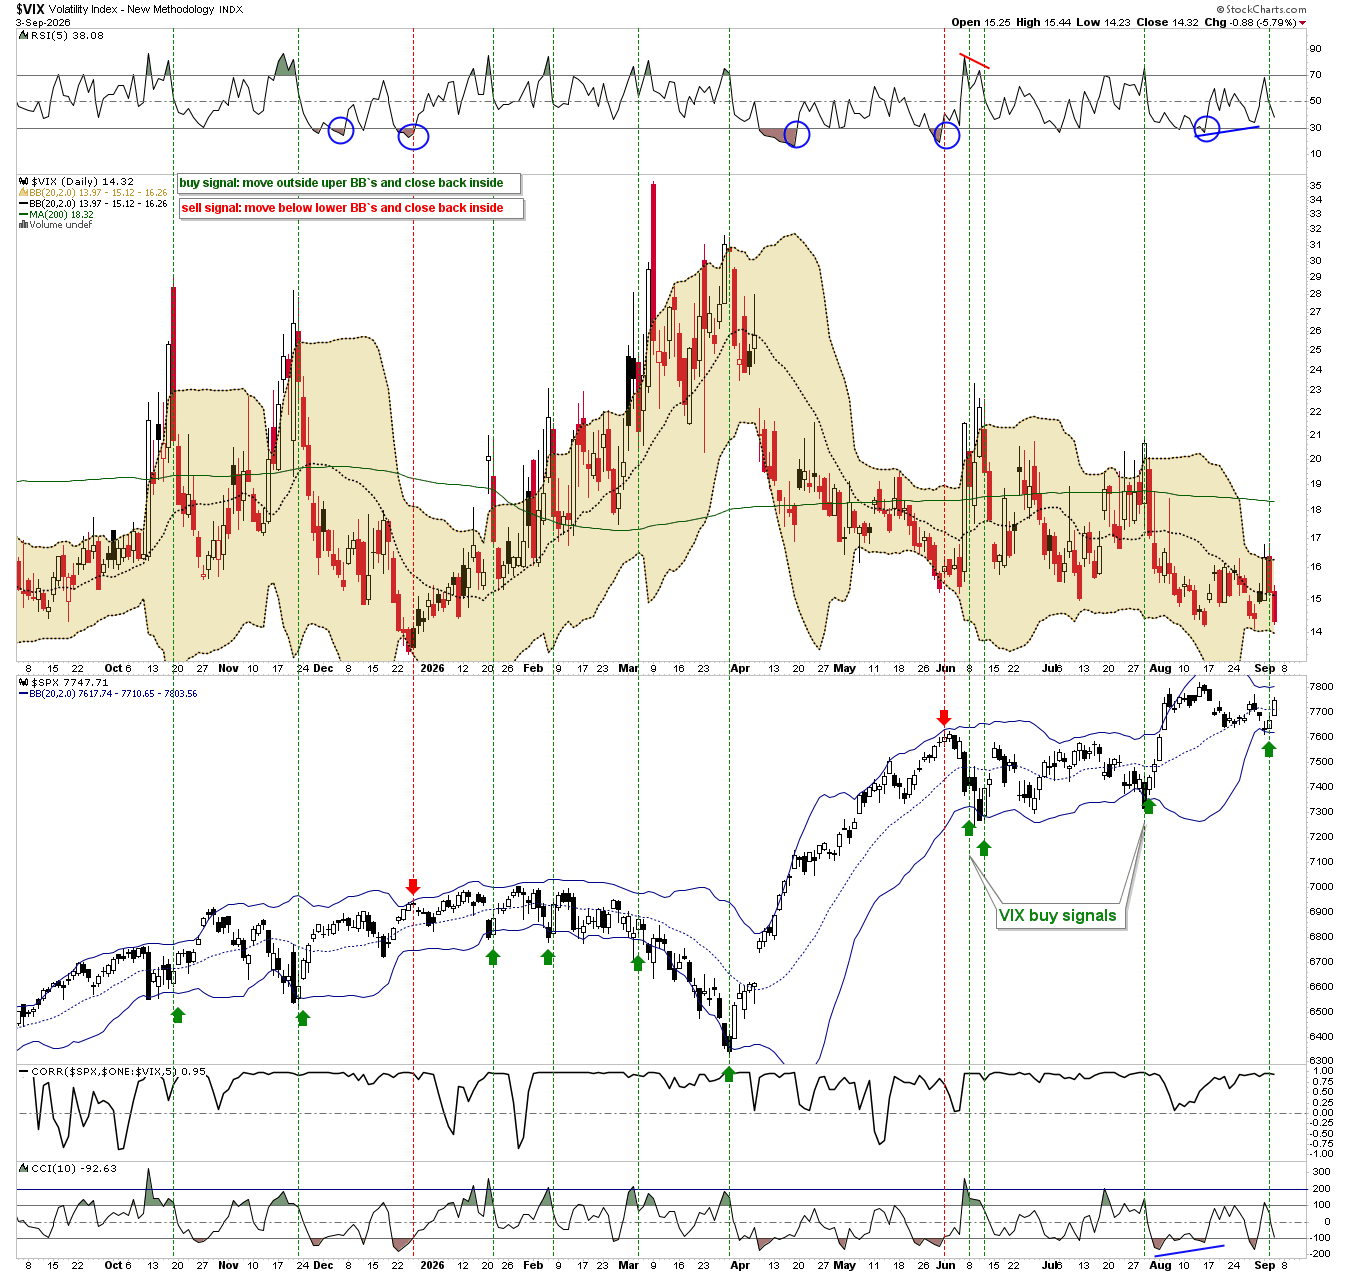 |
| Worth showing the breadth read alongside price. The McClellan closed below its lower Bollinger Band earlier this week and those closes tend to produce reversion-to-mean bounces — which is exactly what we just got. The better signal is when you get positive divergence between the McClellan and SPX, and the green arrows on this chart mark where that's paid. |
| Hans's take: The bounce was set up technically before Waller said a word. His comments were the trigger, not the cause. |
|
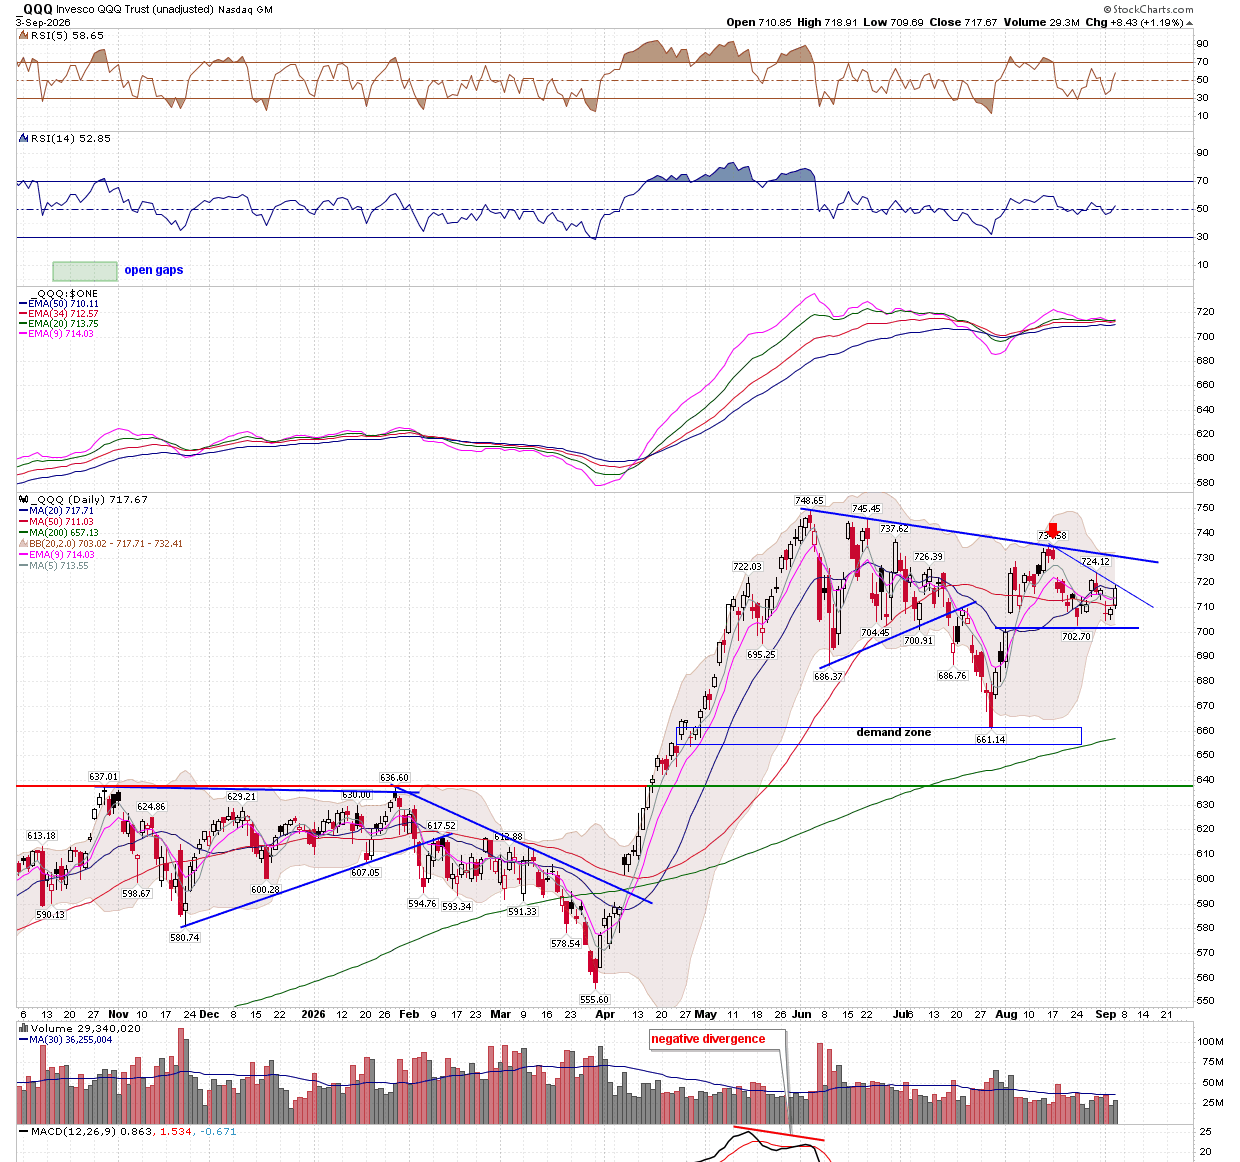 |
| QQQ closed 717.67, up 1.19%, pushing back up off the 700 line it was threatening on Tuesday. This is the level I keep coming back to: above 700, we're in the rotation zone, and that's a healthy market where money moves between themes rather than leaving. Below 700, and really below 690, is the correlation zone, where everything starts moving together and the VIX starts pushing 20 to 23. |
| Hans's take: I'm happy while we're above 700. I've got hedges on, but I don't add more until we're below it. That's the whole framework right now. |
|
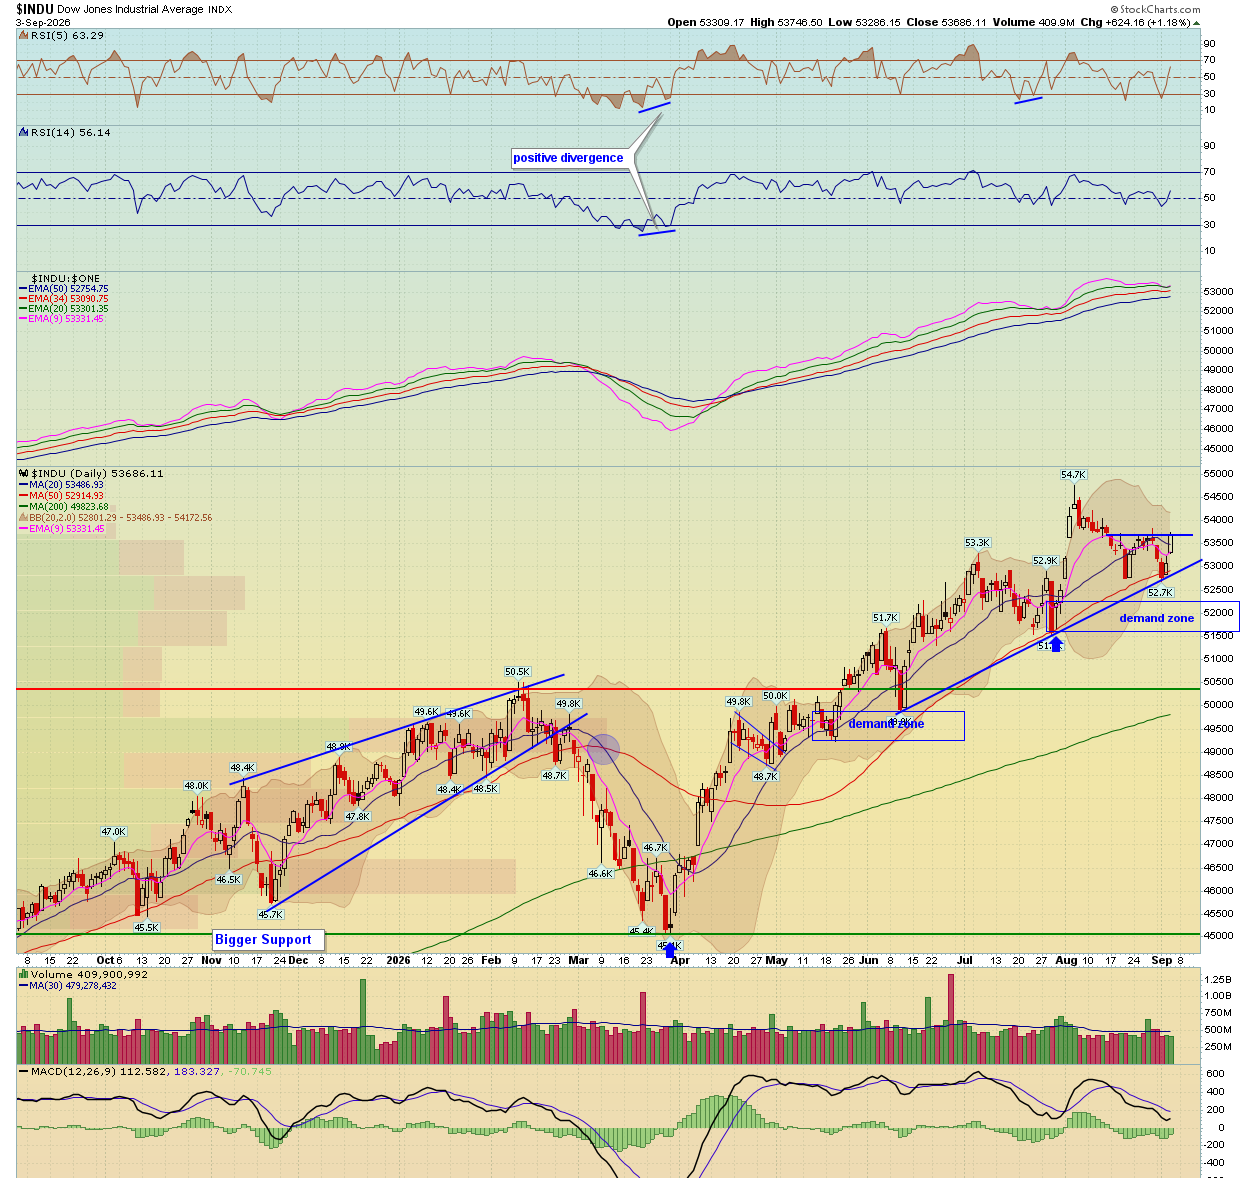 |
| The Dow put in the best day of the majors in point terms, up 1.18% to 53,608. Financials, industrials, and discretionary all doing work. |
| Hans's take: Broad participation on a relief rally is better than a narrow one. Compare this to last Thursday when tech was the only green sector. |
|
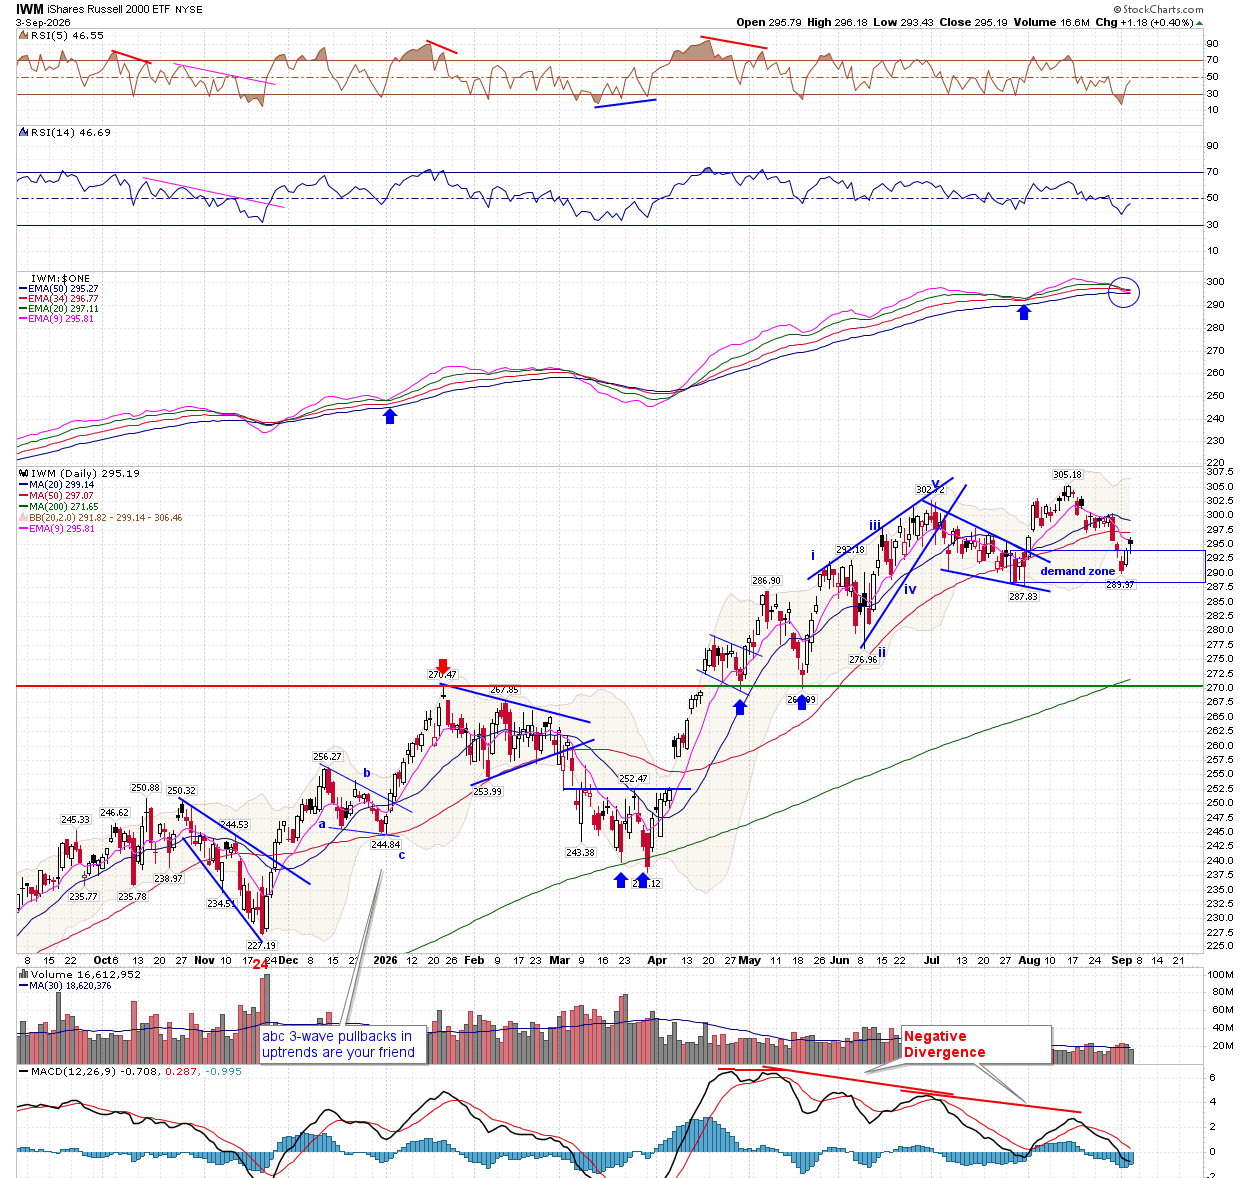 |
| Small caps lagged the majors at +0.40%, but I keep pointing at this chart because IWM has gone from 200 to 300 without needing lower rates to do it. The broadening theme is real — AI benefits are seeping down into the broader economy, not just the megacaps. |
| Hans's take: Rates make this harder, no question. But the broadening thesis doesn't depend on the Fed cutting. |
|
Yields Backed Off. Everything Else Followed. |
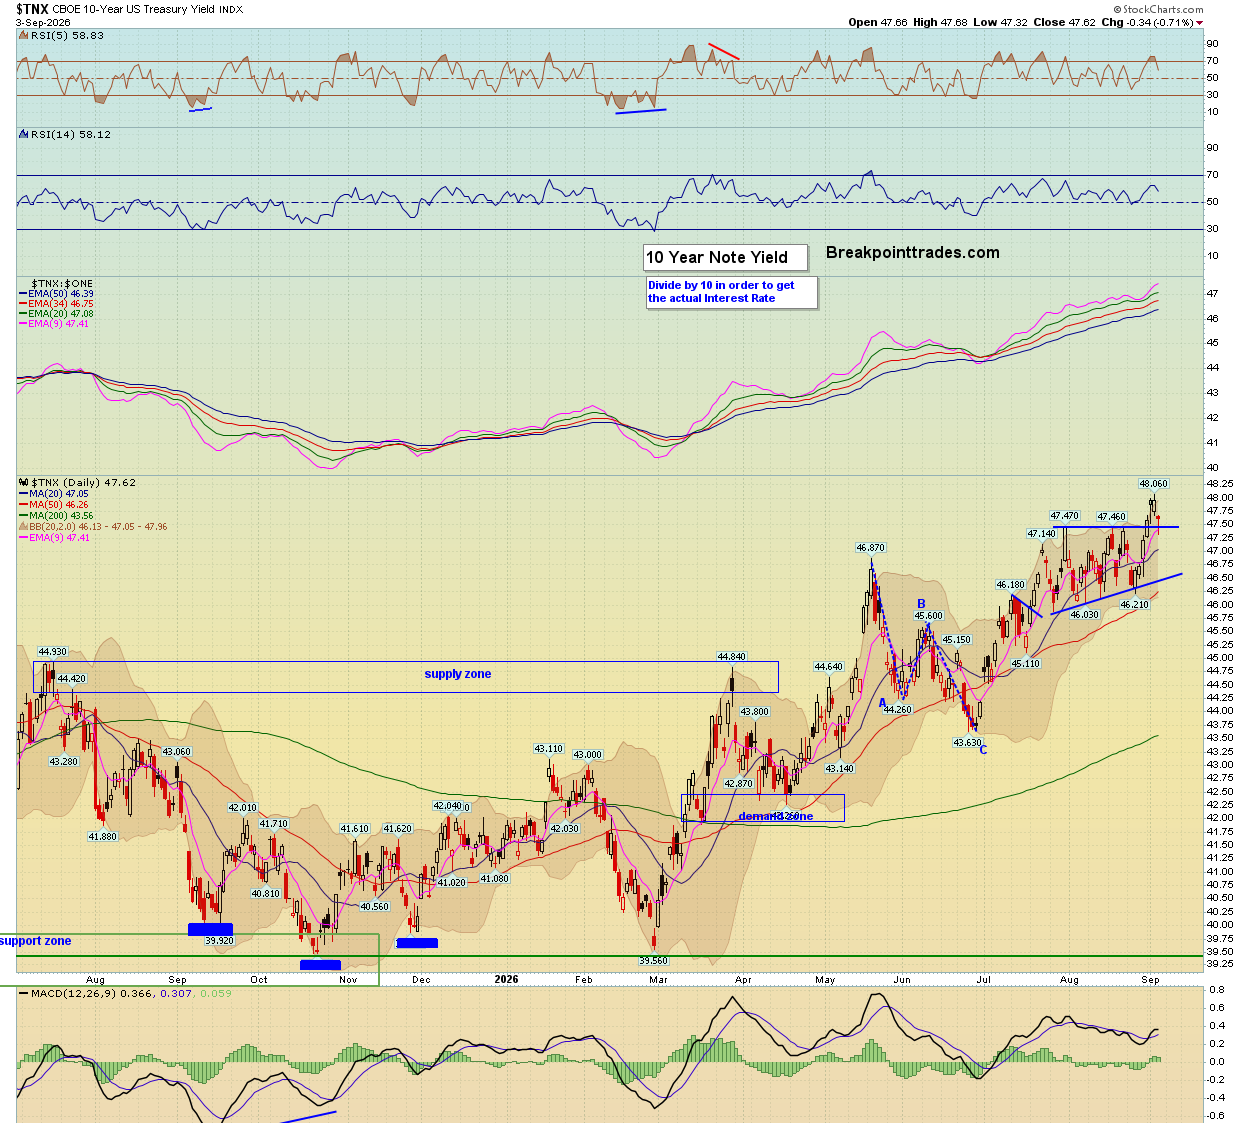 |
| The ten-year fell to 4.762%, down 0.71%, backing off Tuesday's three-year high at 4.80%. The two-year came down harder, toward 4.33%. September hike odds went from near 70% to 50%. |
| Hans's take: This is the chart that's been driving everything for two weeks. When it goes up, the buildout gets more expensive and the market gets nervous. When it comes in, we get days like today. Nothing else has mattered as much. |
|
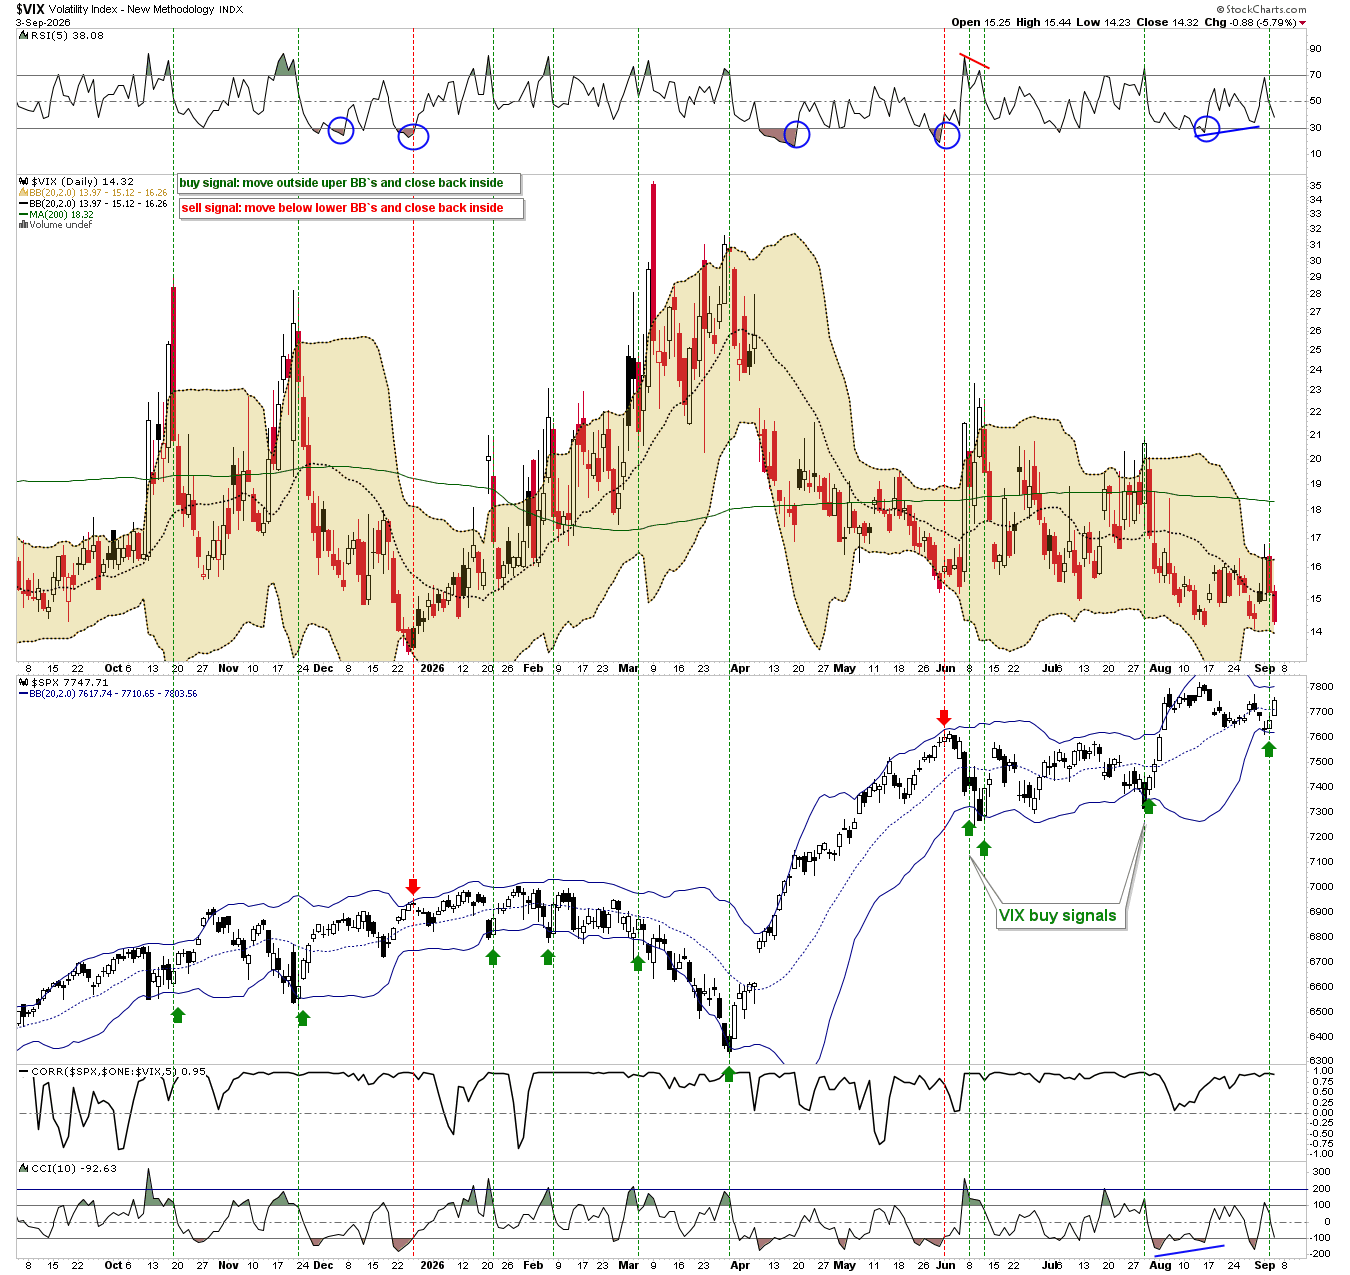 |
| VIX dropped 5.79% to 14.32, right back at the recent lows heading into tomorrow's jobs number and a three-day weekend. Worth noting the Bollinger Band buy signal on this chart fired yesterday, not today — the setup was in place a full session before the Waller headline hit. |
| Hans's take: Second signal this week that fired before the news did. If tomorrow's payrolls are a non-event, this could print a yearly low into the long weekend — that's not a prediction, it's just what the calendar and the positioning set up. |
|
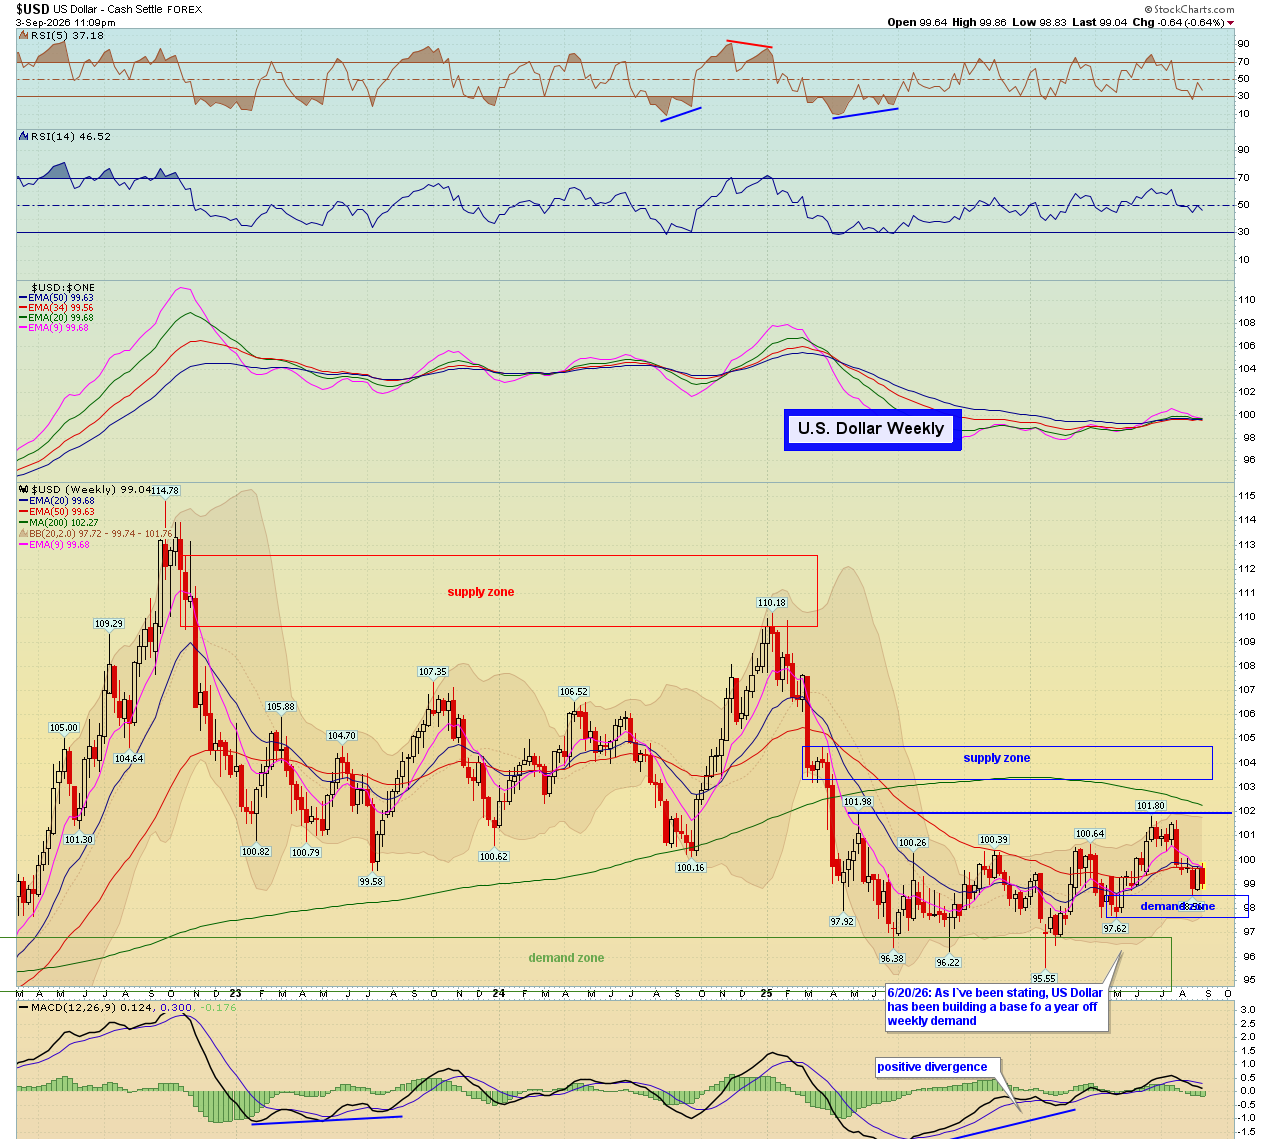 |
| Dollar fell below 99, down 0.64%, giving back the gains it made on last Friday's hawkish Warsh speech. There's also some activity in the yen worth watching, with assumptions of more intervention this week. |
| Hans's take: Dollar down, gold up, crypto up. Same trade, three expressions. |
|
The Data And Memory Trade |
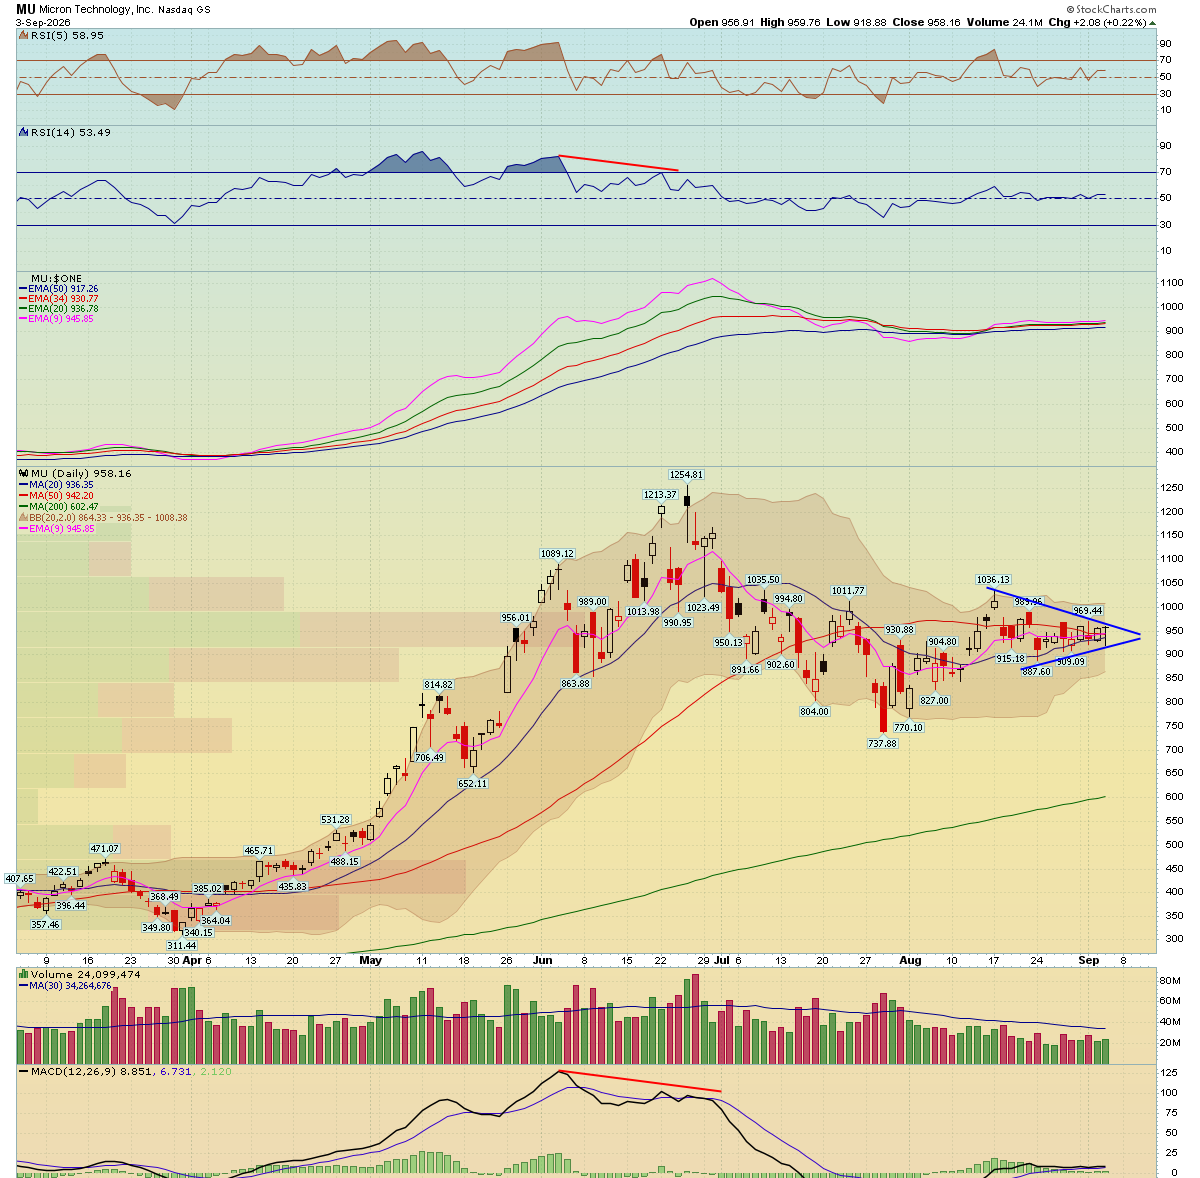 |
| Micron closed 958.16, basically flat on the day but holding the coil it's been building since July. The memory story keeps getting louder — Dell said on its call that its main problem is DRAM, and said it three times. Not servers, not GPUs. Memory. |
| Hans's take: When I look for AI exposure, I want things that almost have to happen. We are going to need more memory. That's not a forecast, that's arithmetic. The agentic wave alone guarantees it. |
|
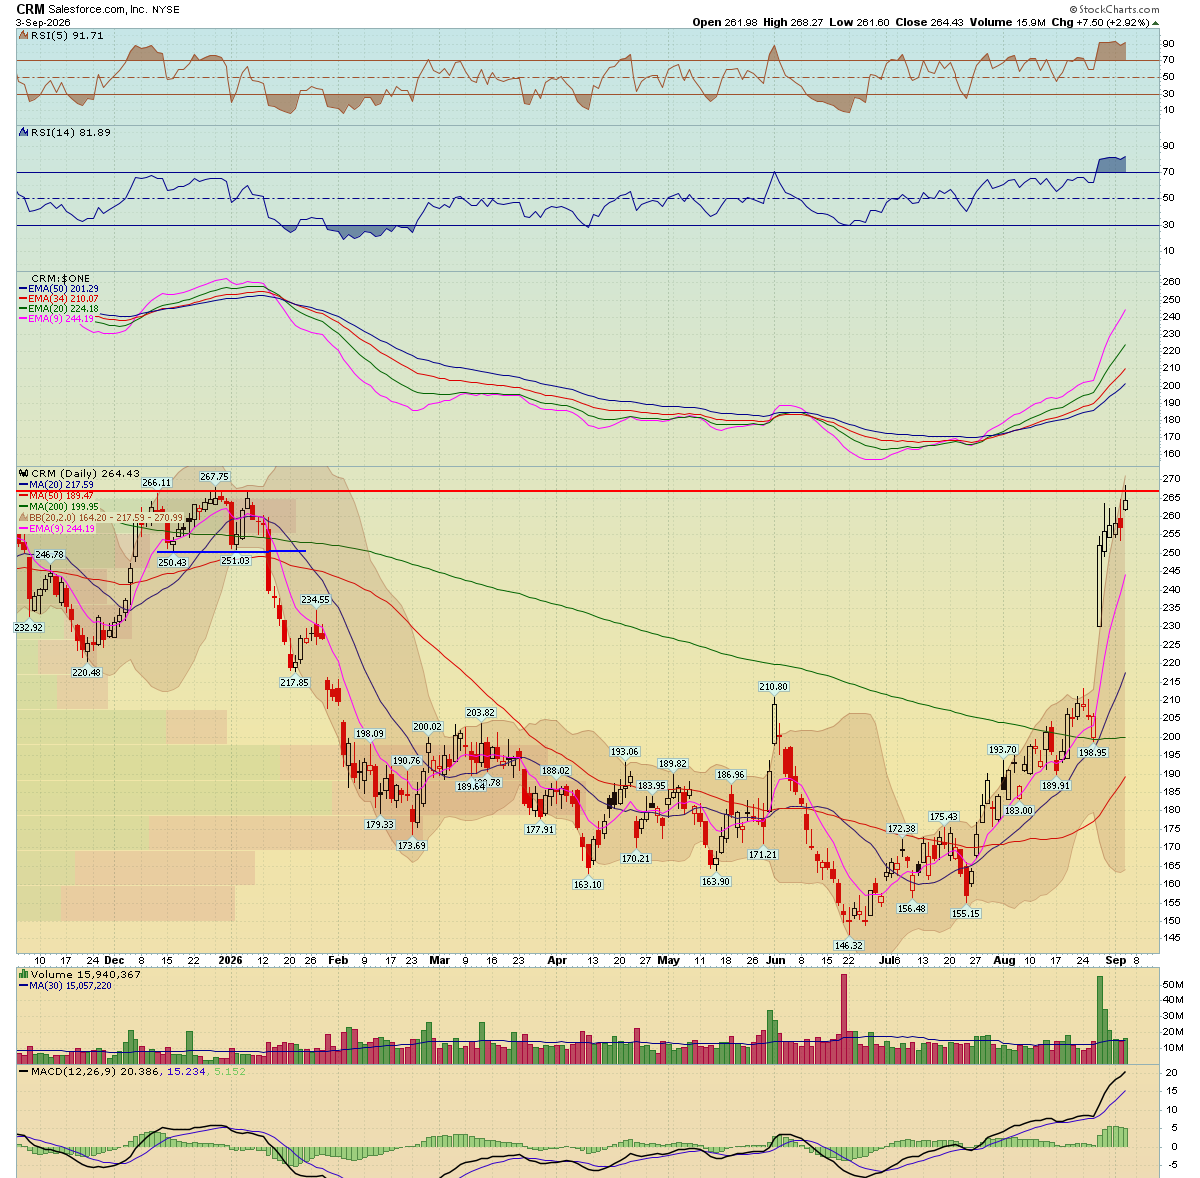 |
| Salesforce closed 264.43, up 2.92%, continuing to build on last week's historic move and now well above the January downtrend line it broke. Software was one of the strongest groups today, led by Snowflake's 20% post-earnings surge. |
| Hans's take: If we're going to have infinite compute demand, we're going to have infinite data that needs storing, analyzing, and siloing. That's what these companies do. The software group is earning its re-rating. |
|
Buildout Names Are Splitting |
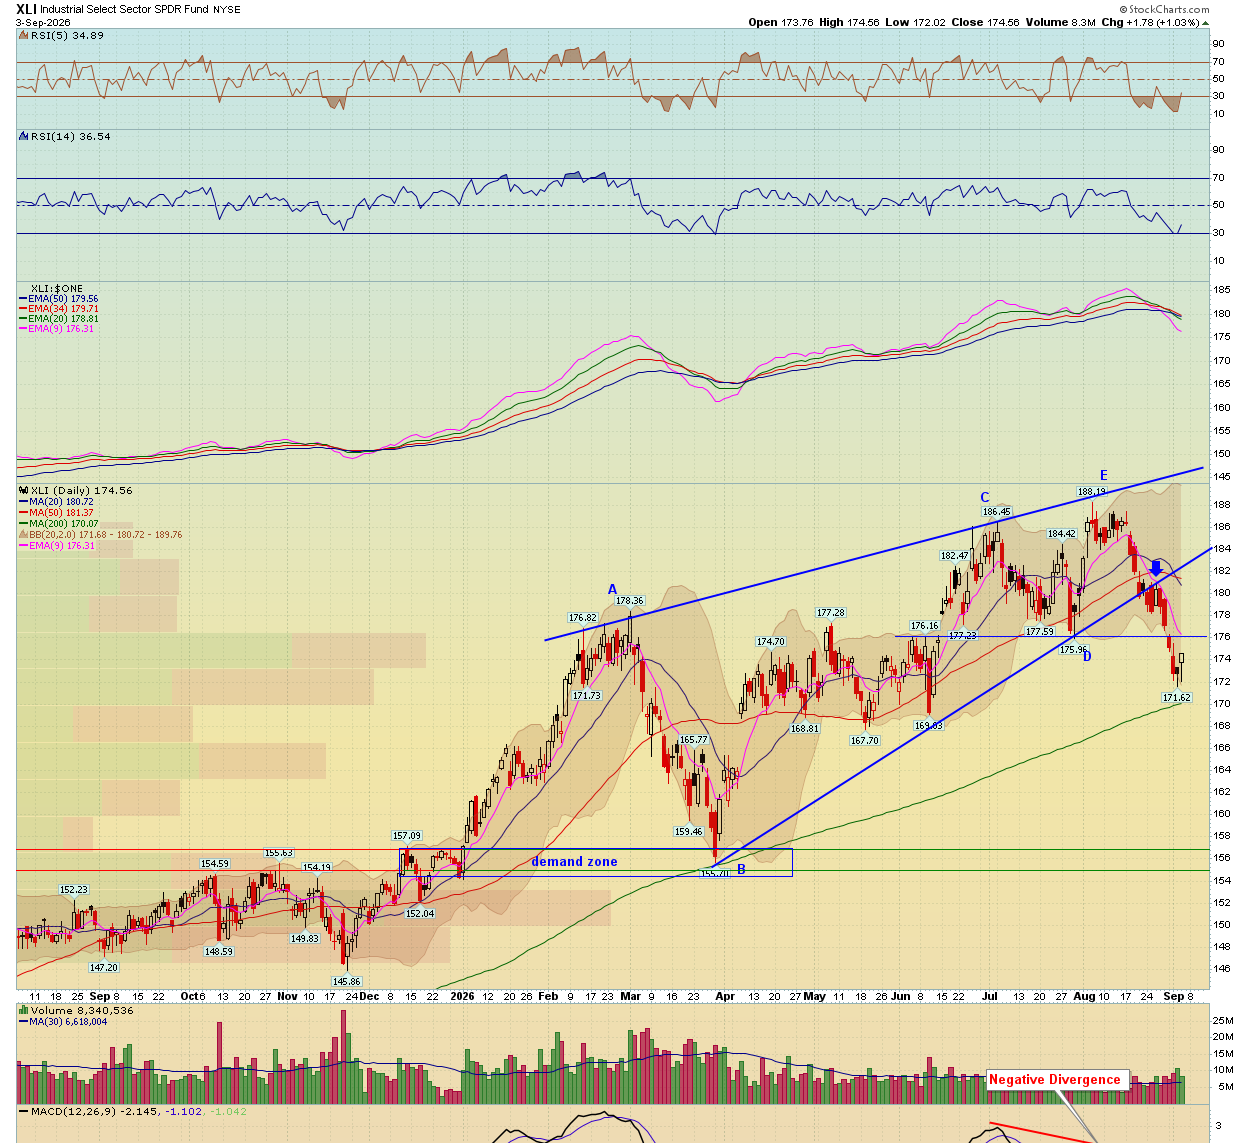 |
| Industrials closed 174.56, up 1.03%, but the sector average is hiding a real divergence underneath. Some of the electrical and infrastructure names tied directly to data center construction have been cut in half or worse from their highs, even after posting spectacular results. |
| Hans's take: A name can put up a 50% move on great numbers, then give the whole thing back and trade below where it started. That's the nervousness about whether these data centers actually get built. |
|
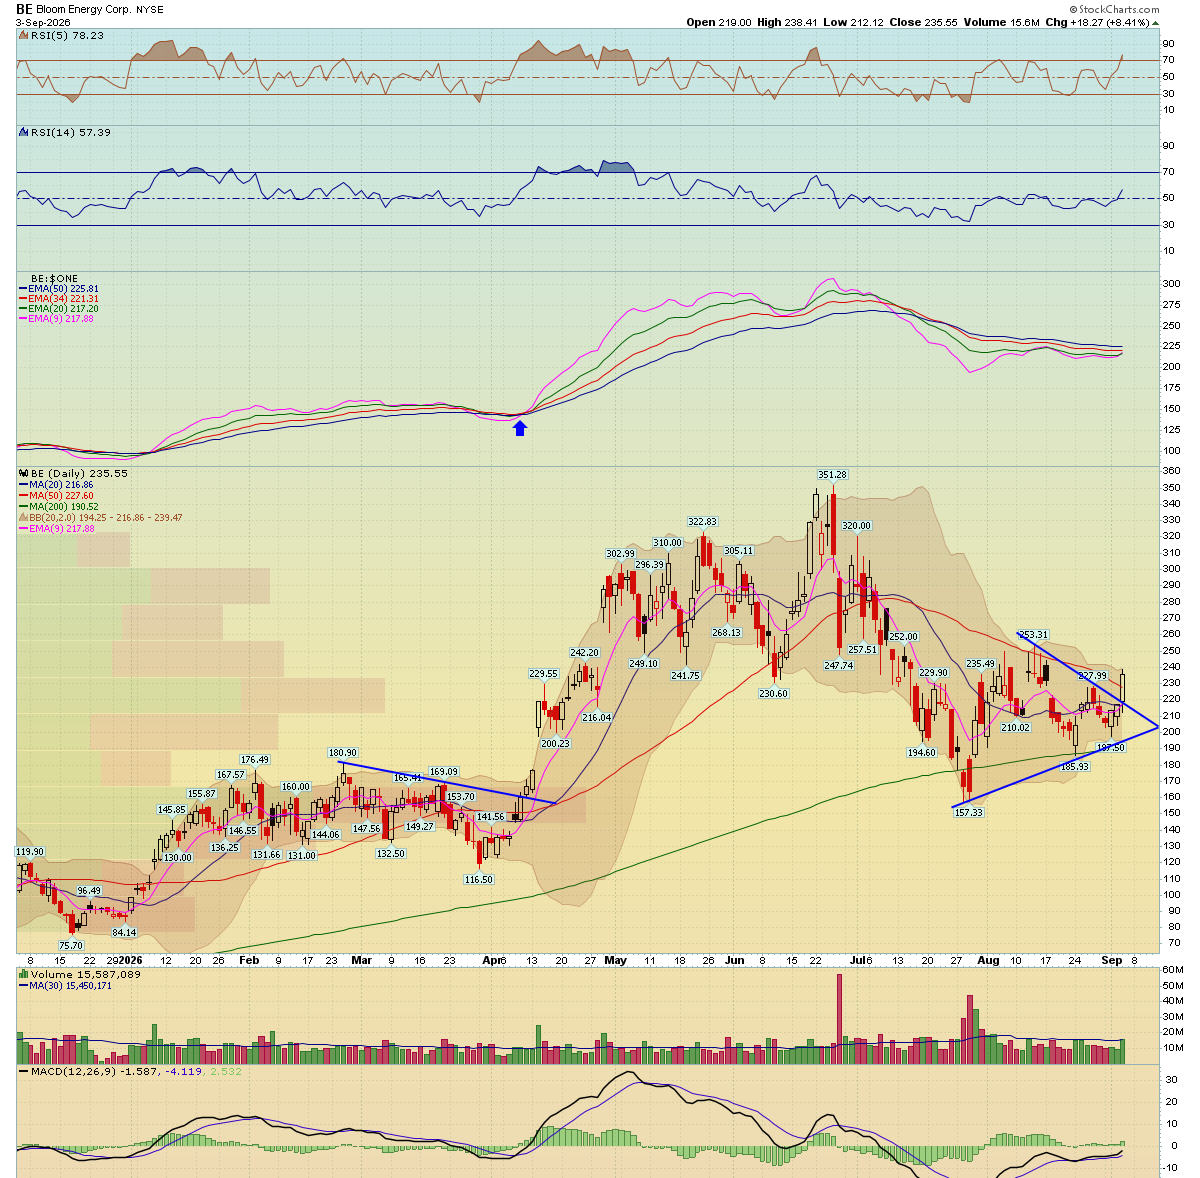 |
| Bloom Energy was the standout, up 8.41% to 235.55. Power generation for data centers is one of the physical bottlenecks that matters most, and this is the name in that group with the cleanest chart right now. |
| Hans's take: I want to see 260 before I call this a real breakout. Until then it's a strong bounce in a name I like the story on. |
|
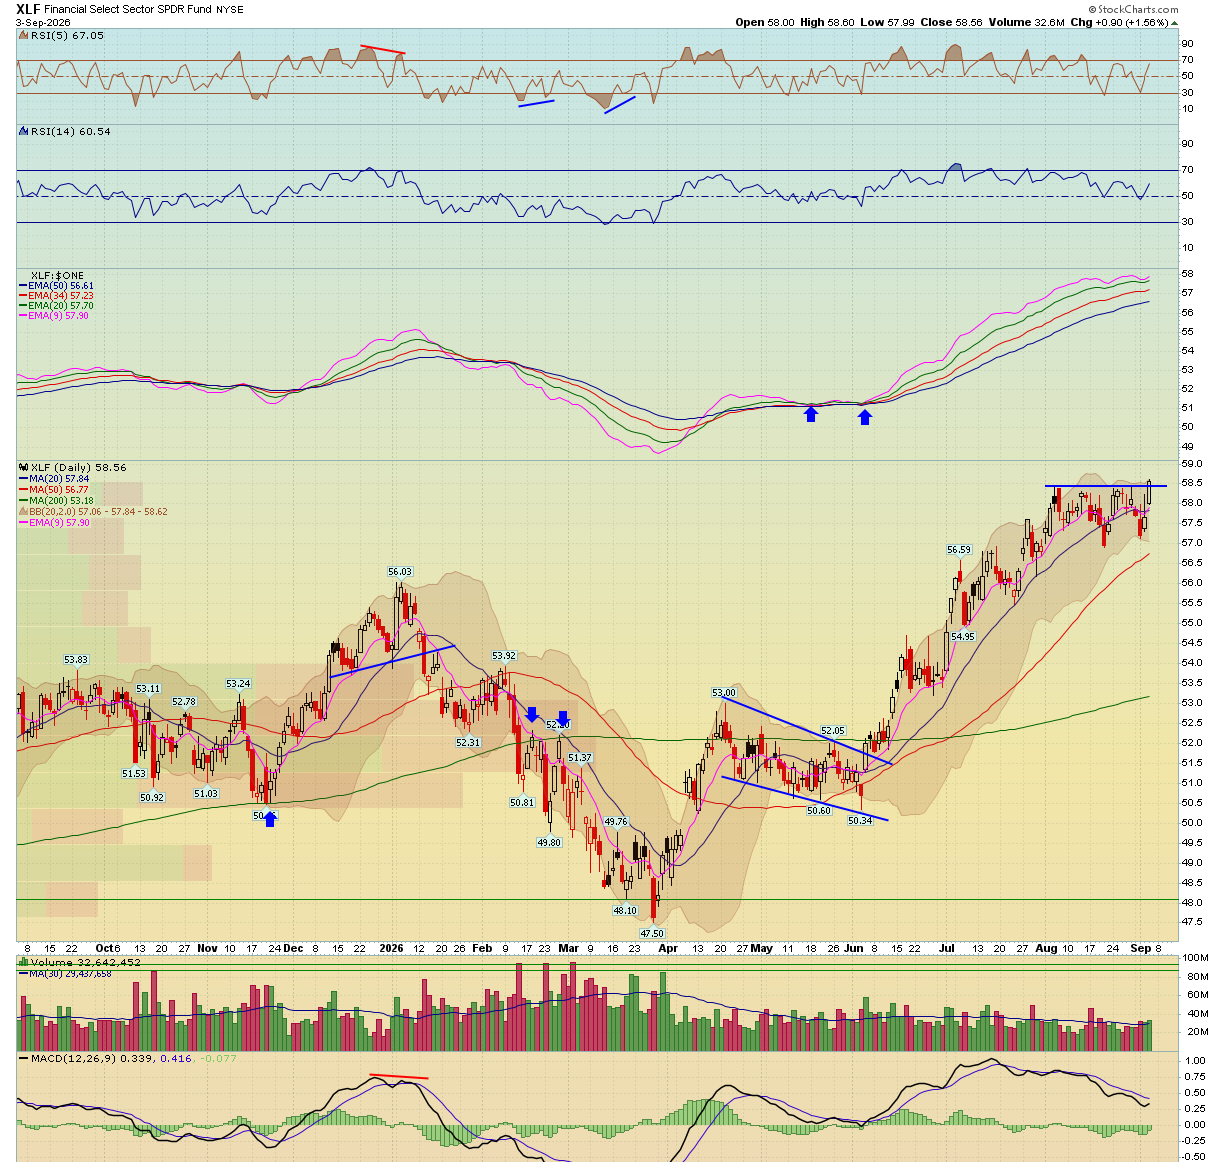 |
| Financials led every sector today at +1.54%, closing 58.55. The group benefits from clearer Fed direction and a steeper curve. |
| Hans's take: Financials broadly look decent on the income indicators. But drill into the subsectors and investment banks have been ugly — that's a distinction worth making before you buy the sector as a whole. |
|
Energy Sat This One Out |
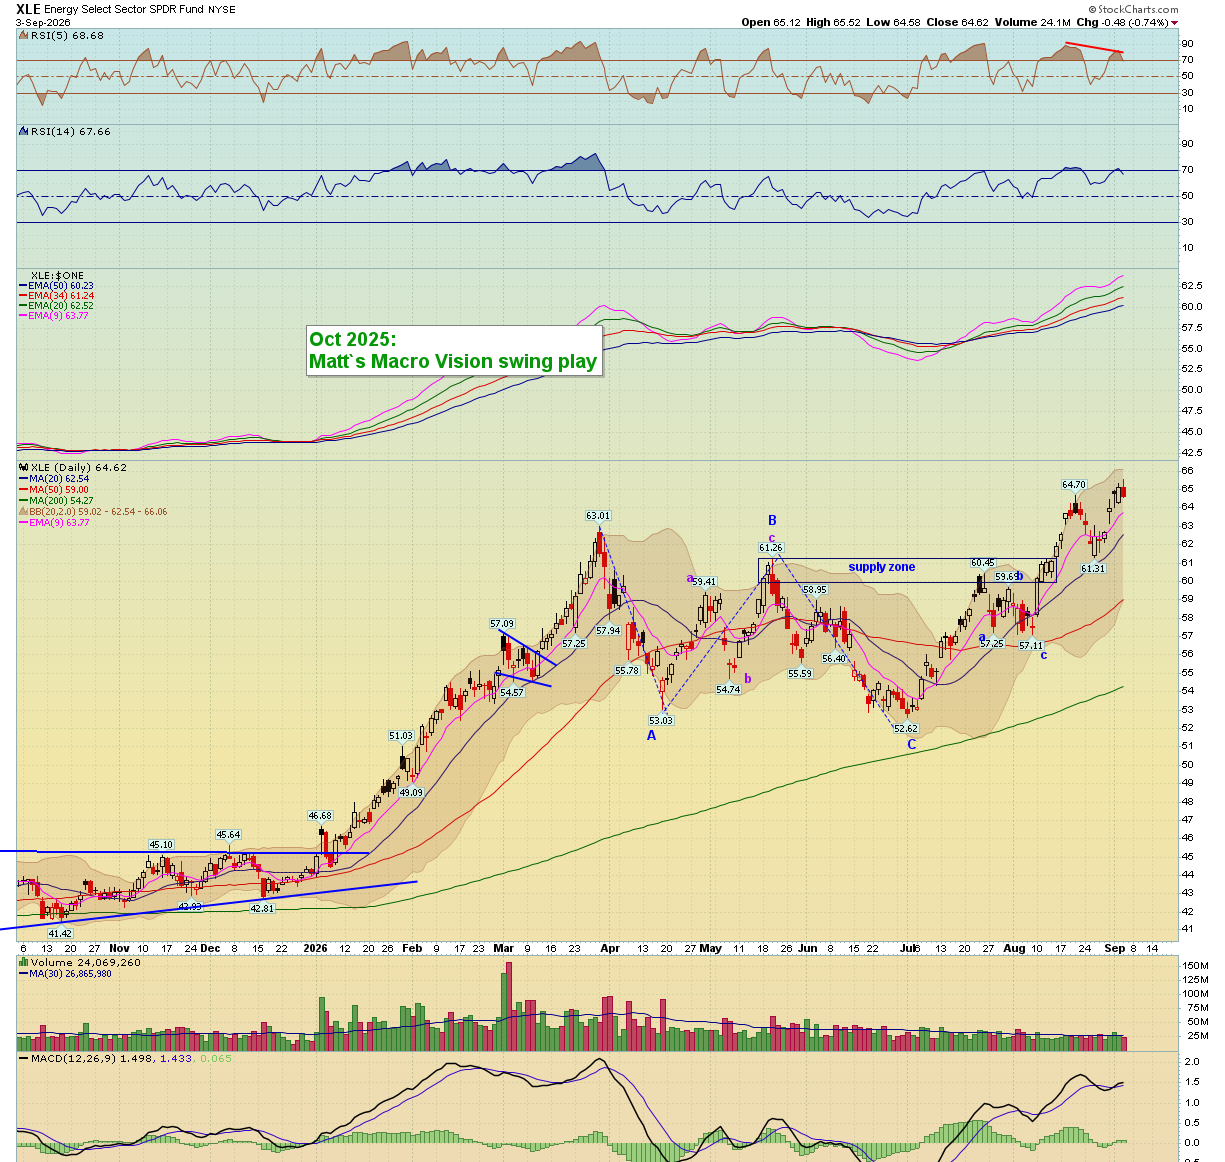 |
| Energy was the worst sector on the day, down 0.69% to 64.62, the reverse of what we've seen for weeks. Crude barely moved, so this was rotation out of the winner rather than a commodity story. But the weekly chart is now carrying both RSI and MACD divergences, and that's the part worth sitting with. |
| Hans's take: Energy has been the best macro call of the year and one red day doesn't break that. But if you've held this since last October you're sitting on a very large gain into weekly divergences, and crude typically softens through the fall. I'm not calling the run over — the balance sheets on these names are excellent and I think they go higher longer term. I am saying this is a fair place to decide whether you want to take something off. |
|
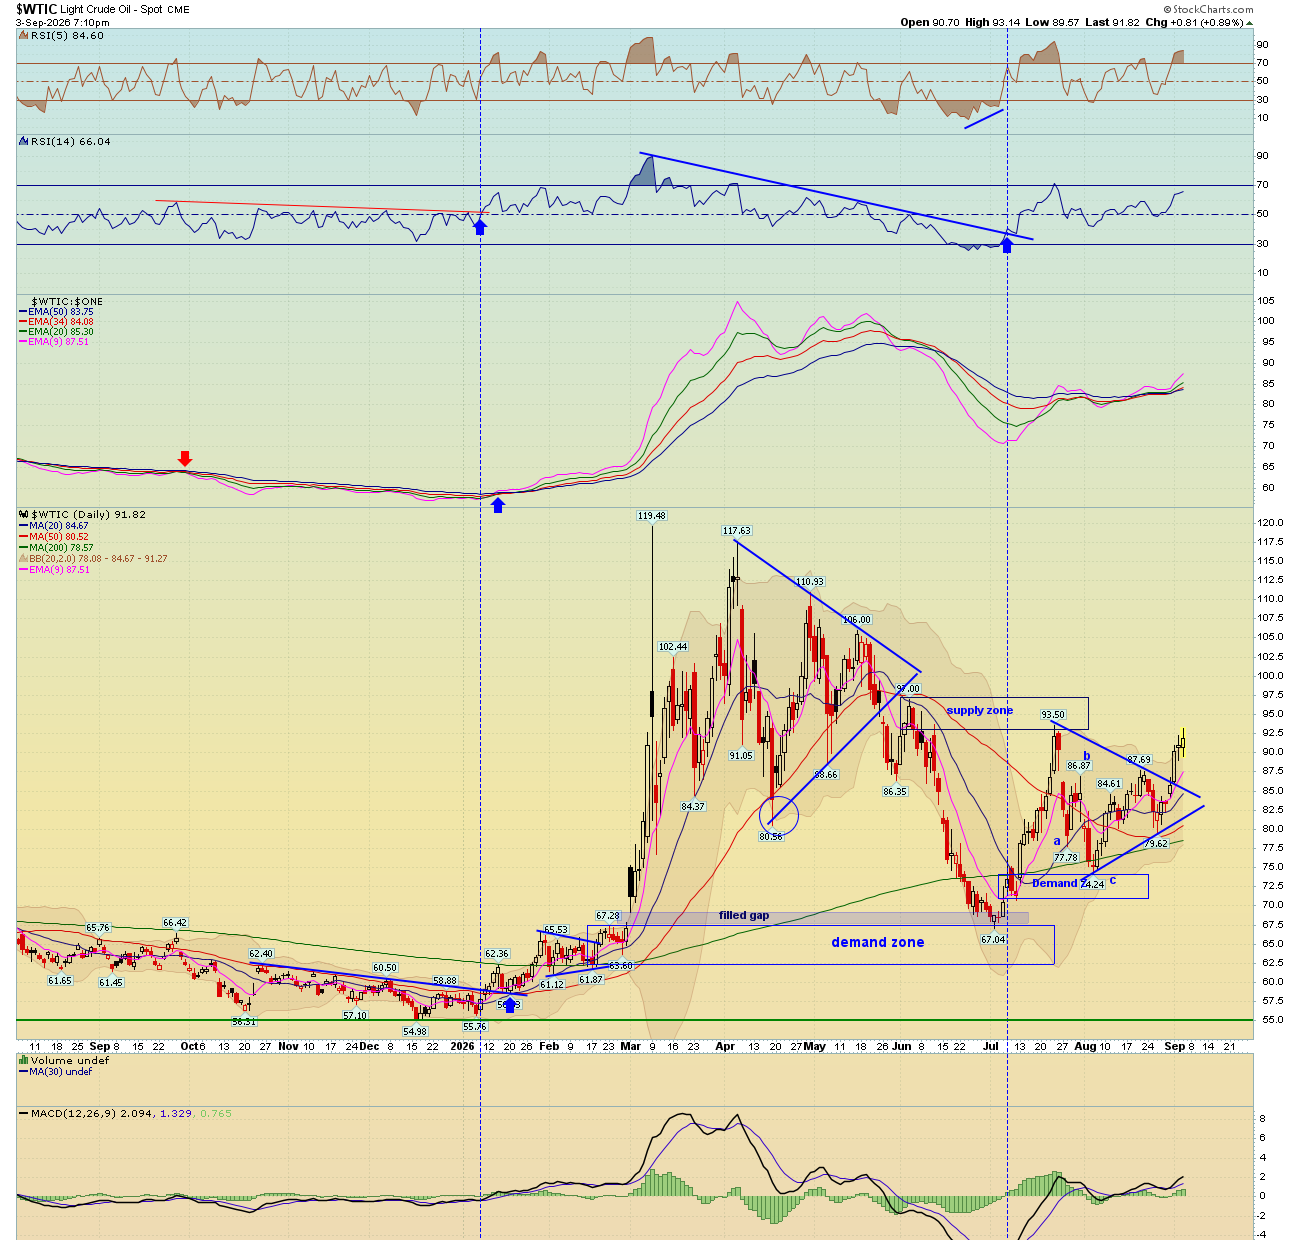 |
| Crude held near 91.82, up 0.89%, staying elevated and relatively stable. The Hormuz escalation premium is still in the price. |
| Hans's take: Oil holding above 90 while yields come down is the friendliest combination this market has had in two weeks. |
|
Real Assets Got Their Day |
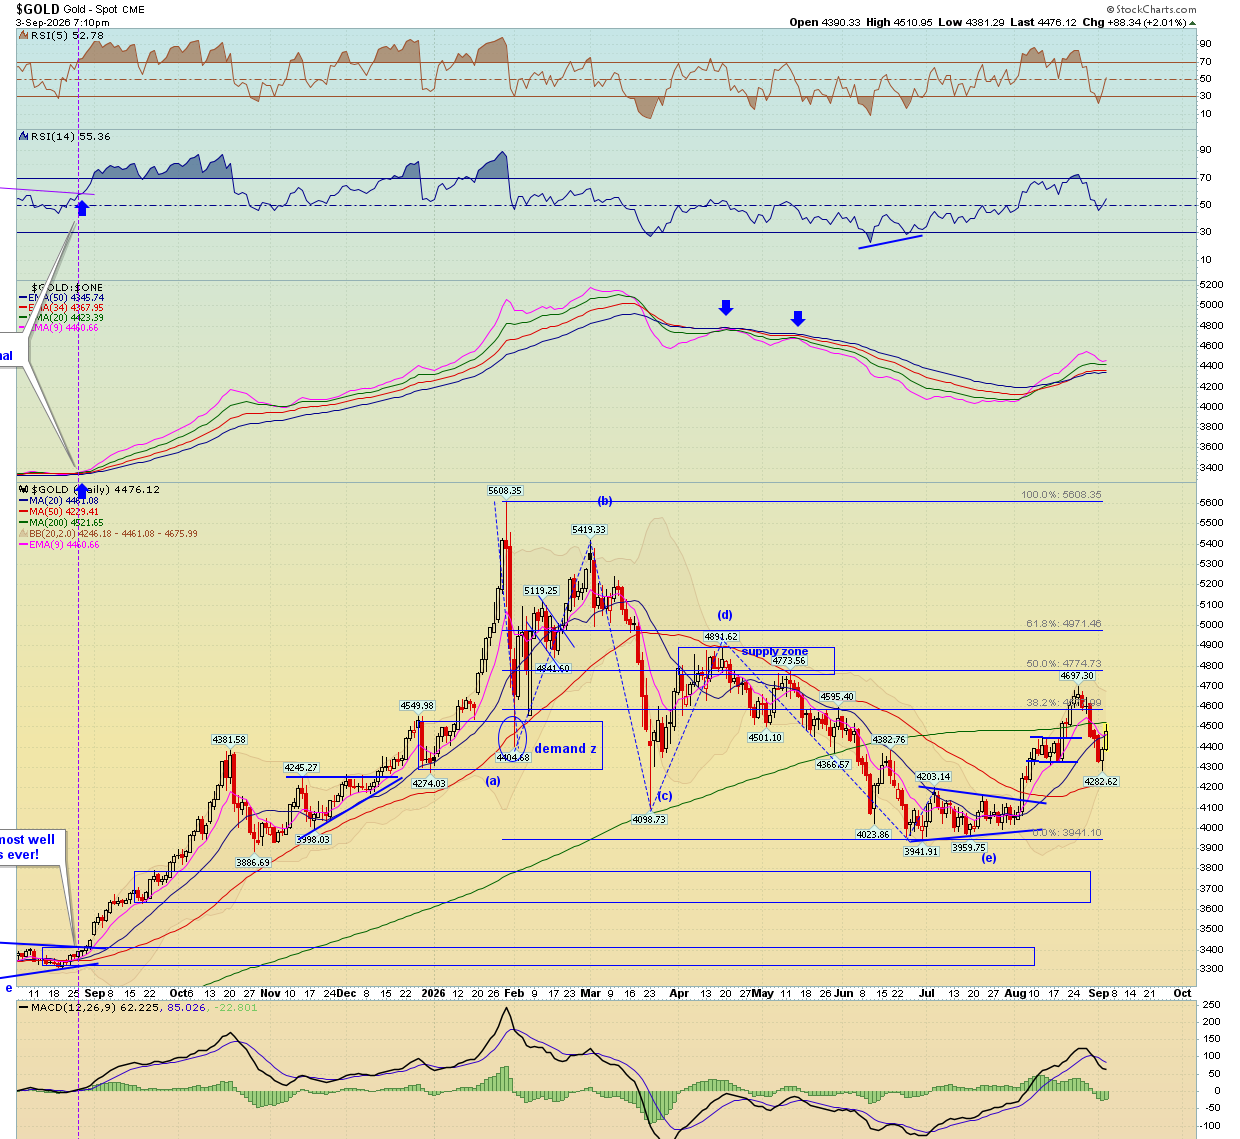 |
| Gold ripped 2.01% to 4,478 on the dollar's decline, and volatility is starting to pick up in the metals complex too. |
| Hans's take: I've been adding to gold personally. The debt, the deficits, the yields, the general level of uncertainty — I think we're causing ourselves problems and gold is a safer place to sit while that plays out. |
|
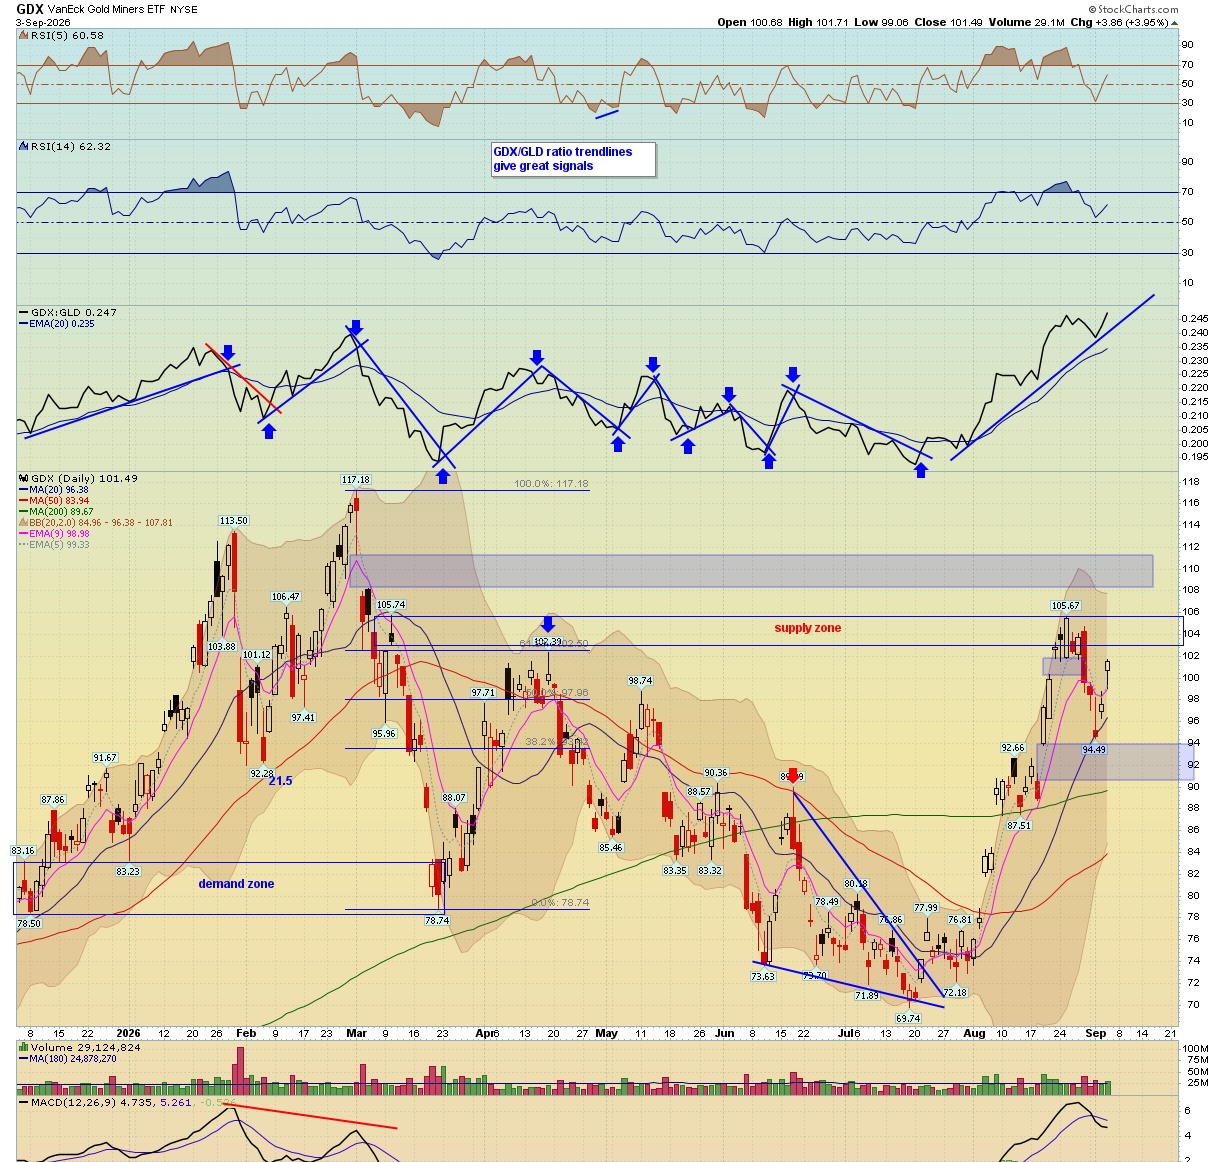 |
| Miners outpaced the metal again, up 3.95% to 101.49, and the GDX-to-GLD ratio is still trending up. That's the condition I set weeks ago and it keeps holding. |
| Hans's take: Miners leading the metal on the way up and holding on the pullbacks. As long as that's true, this group stays in the book. |
|
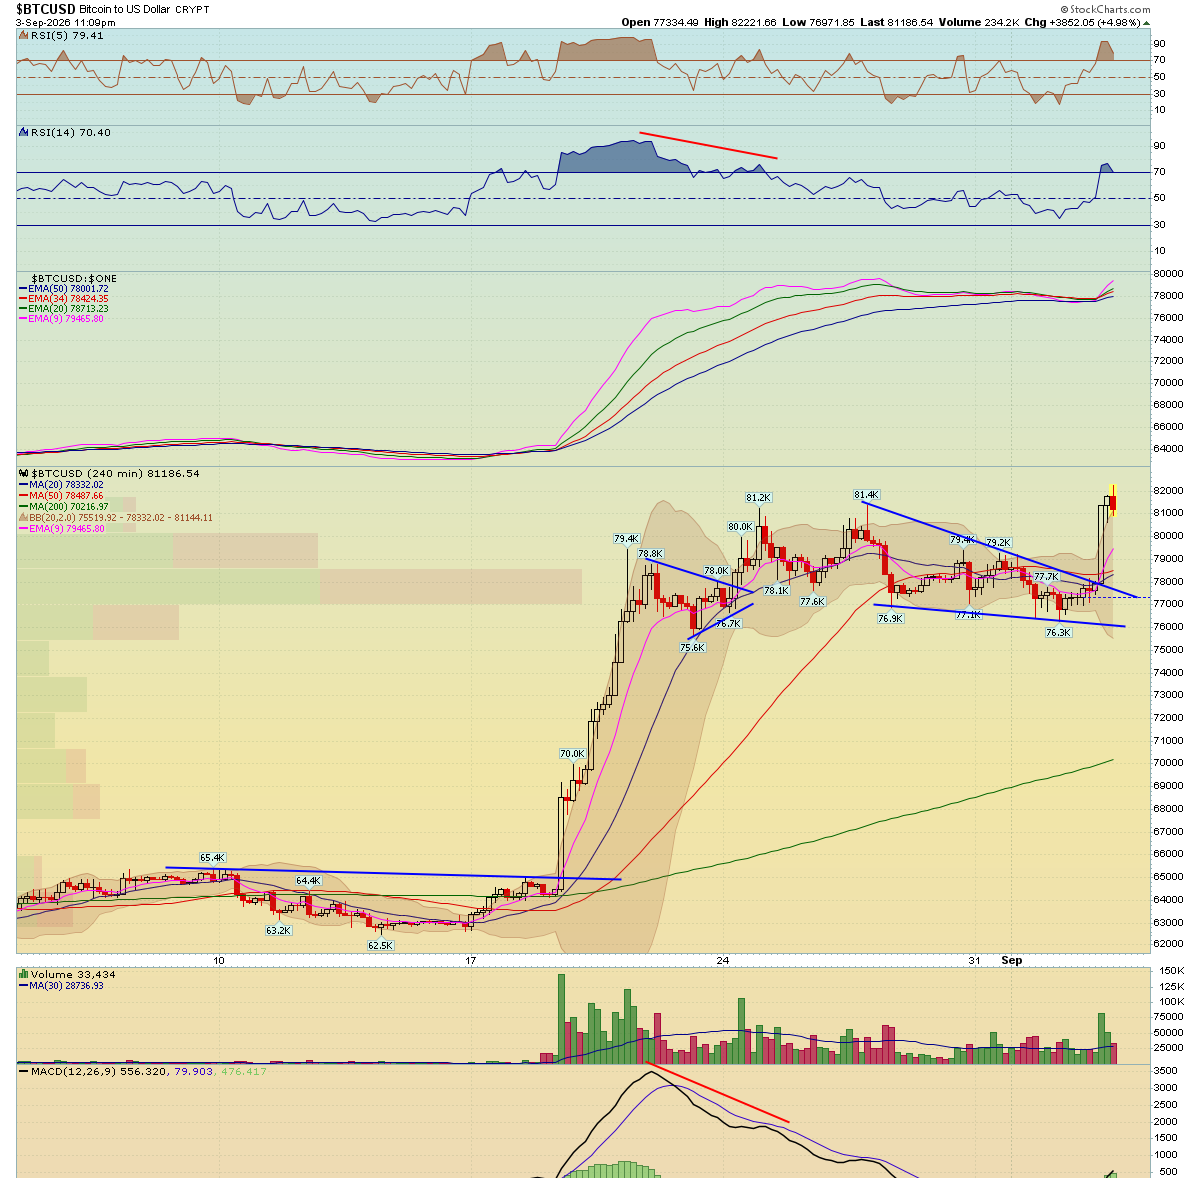 |
| Bitcoin jumped 4.98% to 81,186, back above last week's highs and now just under the 82K level that capped the failed May rally. Coinbase, Circle, and Robinhood all woke up hard on the back of it. |
| Hans's take: This is the third run at 82K. Clear it and the character changes. But when the agentic and crypto names all move together this fast, don't be afraid to take some chips off. |
|
Sector Board |
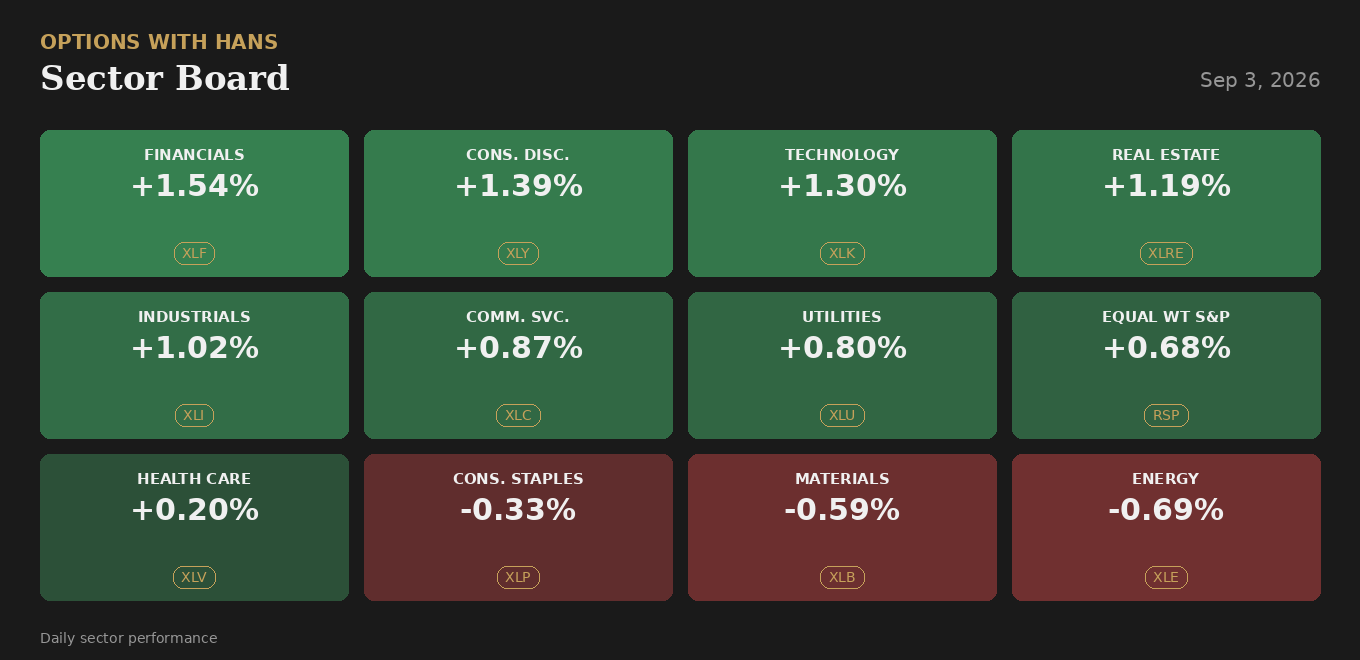 |
| Nine of twelve sectors green, led by financials, discretionary, and technology. Only staples, materials, and energy were red — and energy was the biggest loser, which is the exact opposite of the last two weeks. |
The Through Line |
Two days ago I wrote that the financing leg of the AI buildout was pushing back hard at 4.80% on the ten-year. Today one governor said the word patient and the whole complex exhaled. That's how tightly this market is wound to rates right now — not to earnings, not to demand, to the cost of capital.
The demand side keeps confirming. Snowflake beat and raised. Nvidia is buying Hugging Face for $13 billion. Crusoe signed a roughly $13 billion AI cloud deal. Dell can't get enough memory. None of that is in question. What's in question is whether the physical buildout can keep up — enough copper, enough power, enough permits, enough transformers — and whether it can be financed at rates like these. That's why I keep wanting exposure to the things you can touch and feel: copper, uranium, silver, power generation. Those are inputs somebody has to buy regardless of which model wins.
Above 700 on the Qs we're in the rotation zone and I'm comfortable. Below 690 is where everything correlates and I add to hedges. Payrolls tomorrow at 8:30, expected 56,000 after last month's -23,000 surprise, with less than a 0.5% expected move priced into SPX. If it surprises either way, nobody's positioned for it. |
|
Trade smart, stay hedged.
Hans |
Options With Hans Chart Room · info@cashflowinsiders.com
{% unsubscribe 'Unsubscribe' %} |